(Estimated 5 minute read)
Early on in the Biden administration, Vice President Kamala Harris tweeted the message below. In her tweet, she claimed that the Child Tax Credit (CTC) would cut child poverty in America in half. The question is now if this assessment is correct or if this policy assessment is based on a skewed image presented in the measurements for poverty reduction. Arguably, the latest CTC appears to have some merit, as a few studies have suggested. In this article, some of these points will be addressed and a conclusion on the effectiveness and possible impacts of the policy will be considered.
A brief background on the US Child Tax Credit
Generally, the American taxpayer can utilize a number of tax credits, including the CTC. The first common credit was provided by the Taxpayer Relief Act in 1997. By the end of 1998, the original tax credit was $500 per child under the age of 17. Following the Taxpayer Relief Act in 2012, the amount doubled for the first time. By 2017, Congress had agreed to changes to the CTC under the Tax Cuts and Jobs Act (TCJA), which once again doubled the amount per child from $1,000 to $2,000 and made approximately $1,400 refundable. Ultimately, the TCJA set a limit of 15% earnings above $2,500, meaning low-income filers would not have access to the much needed credit. Furthermore, the Tax Policy Center stated that the TCJA is also set to expire in 2025 and thus the CTC will revert to tax credit estimates prior to 2017. This is indeed a notable aspect to keep in mind when following possible impacts of the American Rescue Plan (ARP)!
CTC under the American Rescue Plan: Cutting poverty in half?
Having a base understanding on the origins of the CTC, the ARP comes at a critical time following the COVID-19 pandemic in order to enhance the previous endeavors. As the American Rescue Plan’s CTC outlines, tax filers could claim $3,600 per child under the age of 6 and up to $3,000 per child ages 6 to 17. However, compared to previous CTC measures, the ARP added a unique angle to this tax issue. Rather than receiving one lump sum when taxpayers file their returns, the IRS was directed to disburse monthly advanced payments as of July 2021. With the current disbursements, the CTC is set at $300 per month for each child under 6 and $250 for each child between 6 to 17 for the next six months. As a result of the legislation and the actions taken, the total annual poverty rate is estimated to decrease from 13.7% to 8.7% (directly impacting the child poverty rate as well). This estimate was found in combination with extended pandemic related unemployment benefits, the Supplemental Nutrition Assistance Program benefits (SNAP), the $1,400 recovery rebate, and lastly the advanced pay of the CTC.
According to the same study by the Urban Institute, these measures have the potential to reduce the projected number of people in poverty in the US from 44 million to 28 million. Moreover, apart from the decrease in annual poverty, this estimate indicates the projected poverty rate for children would be cut by half. As pointed out in a previous Policy Crossroads’ article, the measurement of poverty heavily depends upon a number of questions. As is the case in many studies, we must not only consider who compiled the data but which metrics are being used in the analysis. To illustrate, the 2019 US census has shown an official poverty rate of 10.5%, with 34 million people in poverty compared to the different estimates from the Urban Institute in the same year.
Bearing these details in mind, it is perhaps most useful to take a step back and look at the historical trends on children in poverty. The graph below shows the child poverty rate in the US from 1990 to 2020 based on data from the Current Population Survey (CPS). As the graph indicates, the child poverty rate was the lowest in 2019.
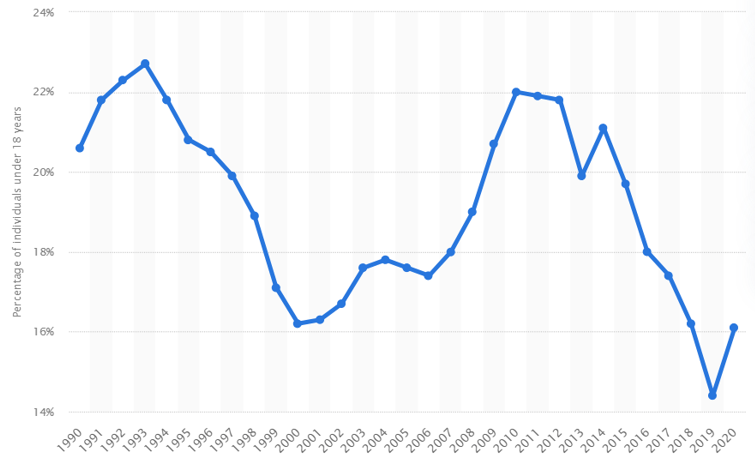
Effectively, the graph also shows a steady decrease in the child poverty rate from 2014. What is interesting there is the rise in rate of child poverty throughout the 2000s and the fall again from 2014 onwards. It thus begs the question how effective the previous CTC measures were.
Now to return to the fundamental question raised here, will the ARP CTC cut child poverty in half? A typical answer in the academic community might sound something like, “it depends”. However, the central point it depends on here is relatively straightforward. It primarily depends on whether Congress will approve the CTC measures to keep up this current commitment. In a recent letter to Congress, more than 400 economists urged them to continue the CTC on a permanent basis. In their arguments, the economists detailed how the CTC can drastically improve the lives of millions of children and promote long-term economic prosperity by reducing child poverty. Moreover, the Russell Sage Foundation published a research article in 2018 calling for a universal child allowance, which would steadily reduce the child poverty rate. As evidence that such a policy would indeed have such an intended impact, one recent study found the monthly installments have already shown a significant decrease in child poverty.
Towards universal child benefits
Apart from some of the diverging estimates on poverty in the US, there is ample evidence that the trends, whether increasing or decreasing, are usually similar. So, will the new CTC measures cut poverty in half? Considering the available evidence, it is highly possible this might be the case. Besides other factors, such as the economic impacts and recovery following the COVID-19 pandemic, and state legislation on wages, the tax credit plays some role in child poverty. Throughout the previous fluctuations in the child poverty rate, a CTC was offered, even as the effects of the 2008 financial crisis took hold. Where the difference effectively begins to matter ultimately rests upon future commitments which turn the tax credit into a stable universal child benefit. On that note, there is reason for optimism that this policy will continue throughout the Biden administration. If not, it will be difficult to unravel whether six months of a child allowance will create long-term impacts on the child poverty rate.
